Schleswig-Holstein
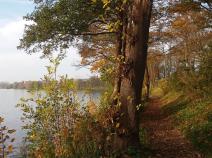
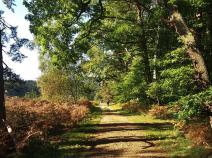
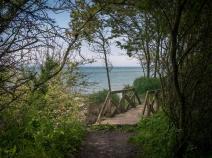
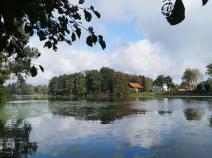
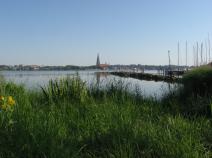
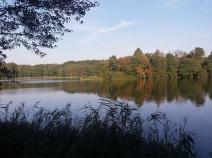
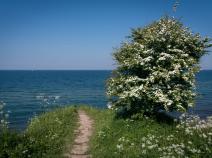
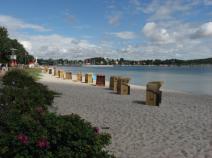
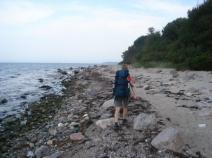
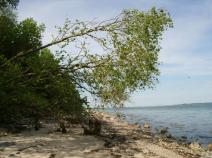
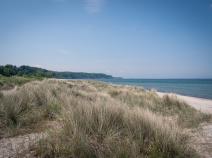
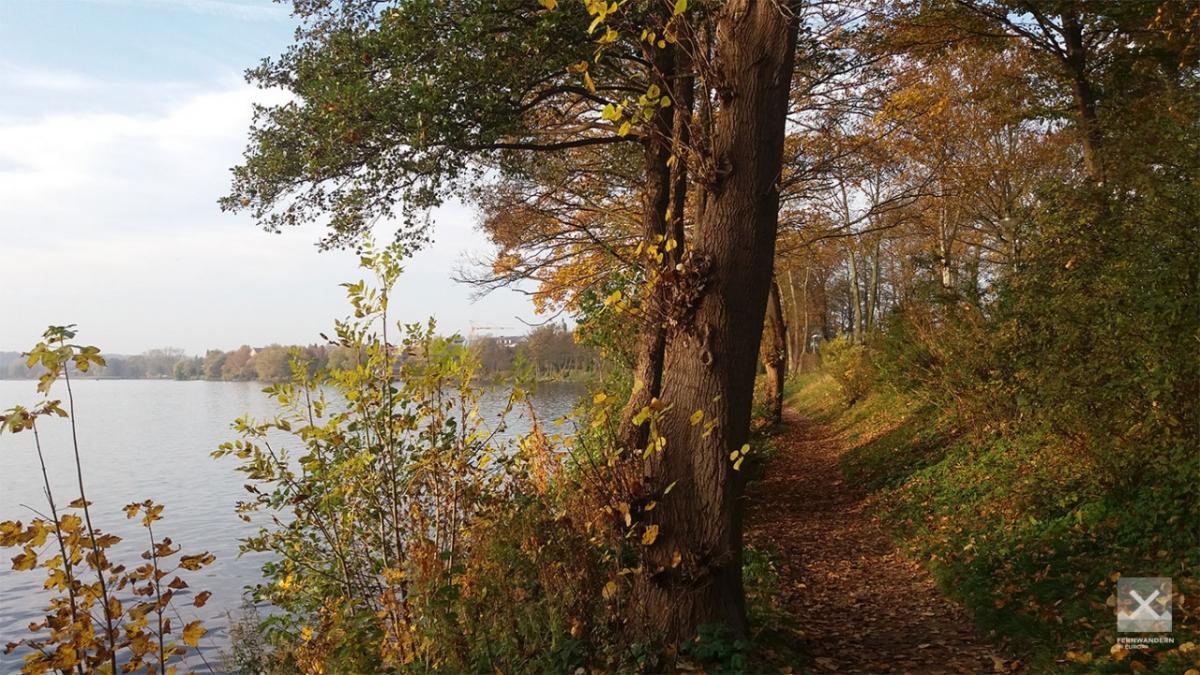
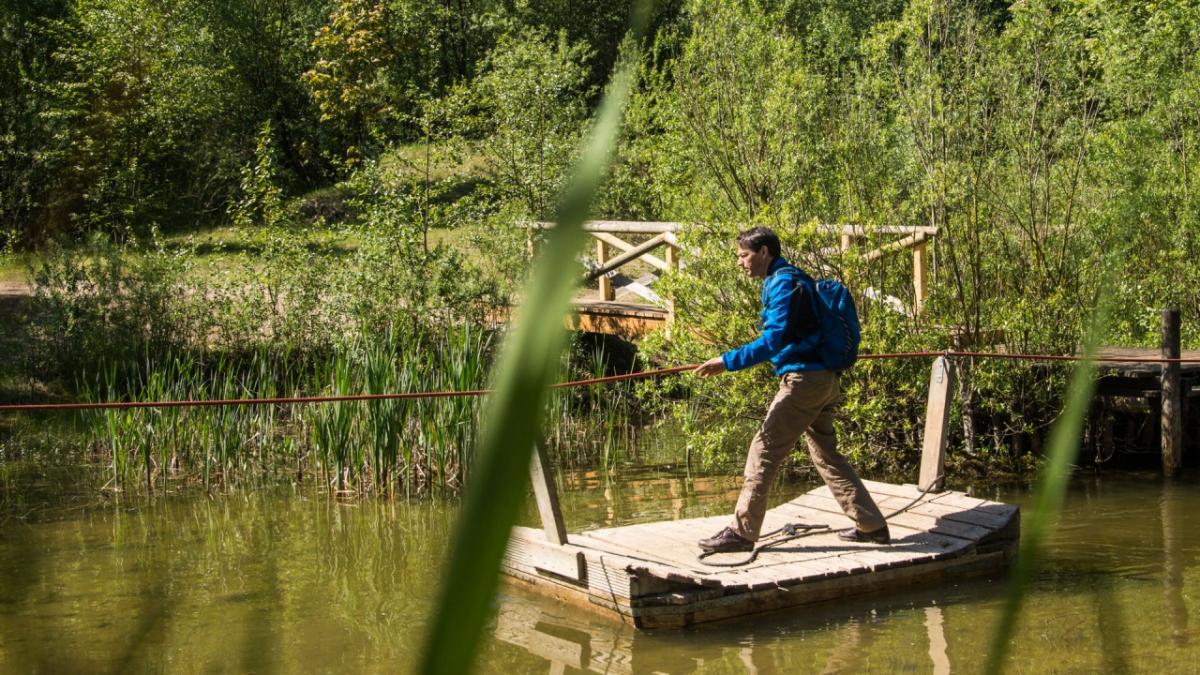
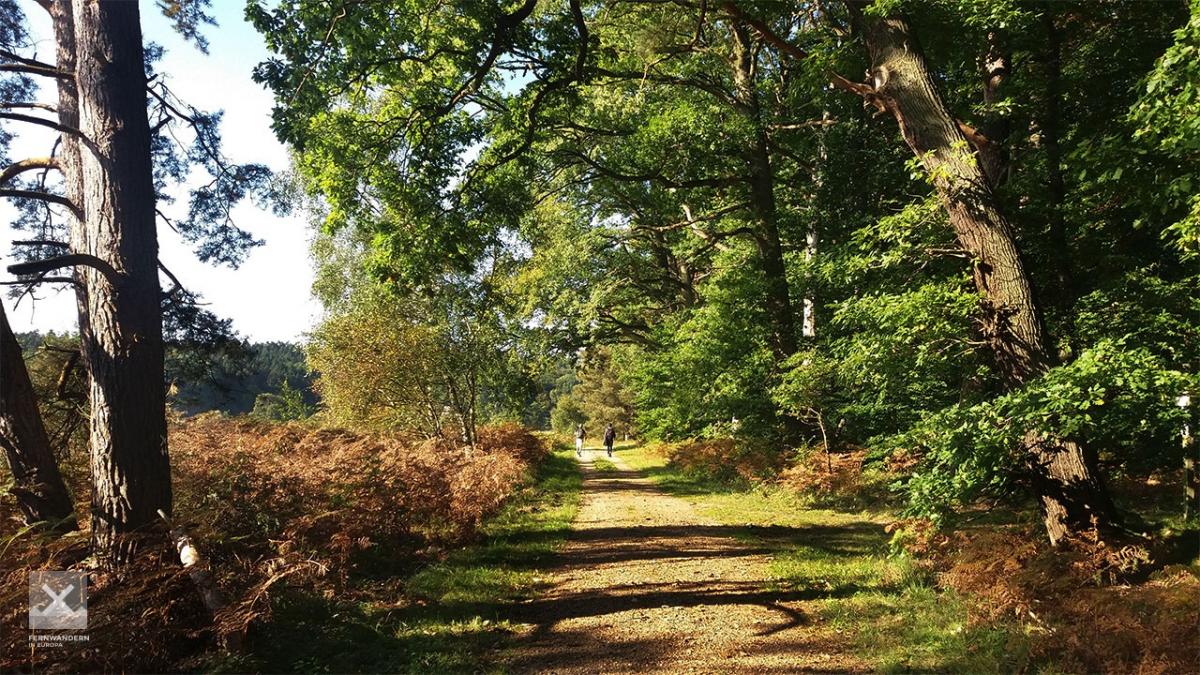
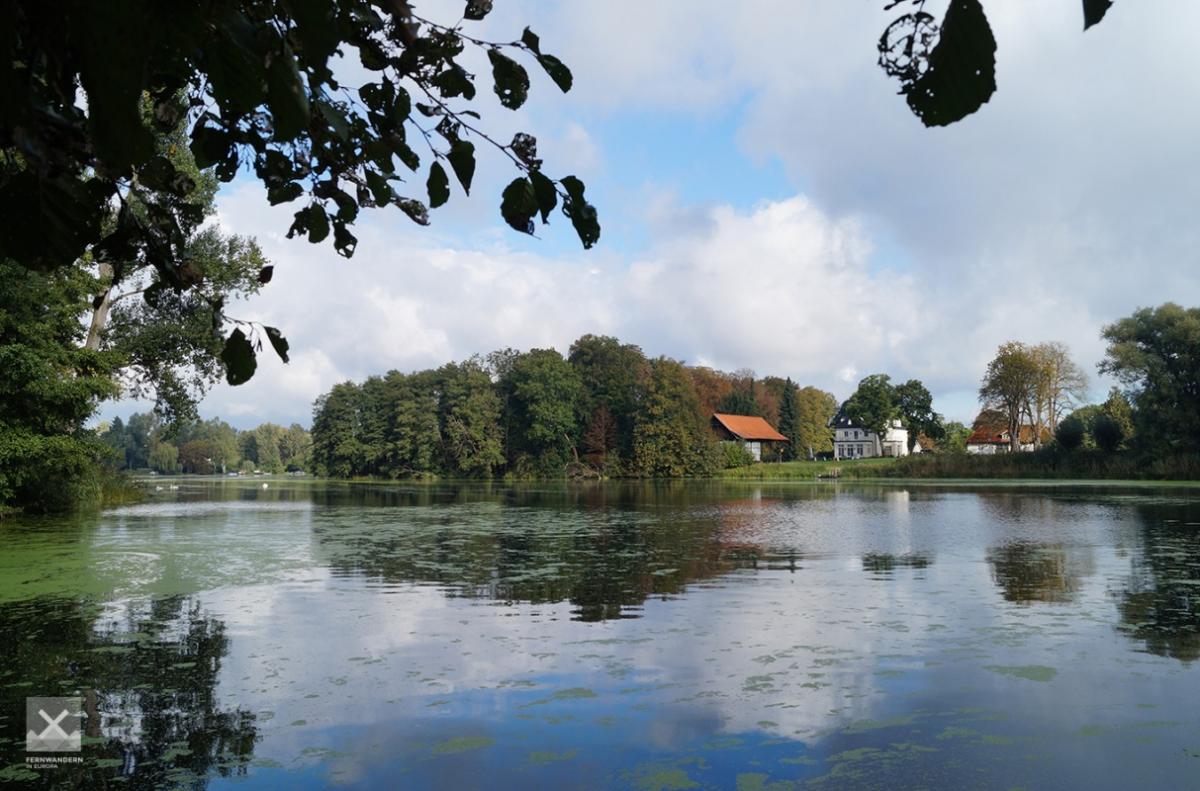
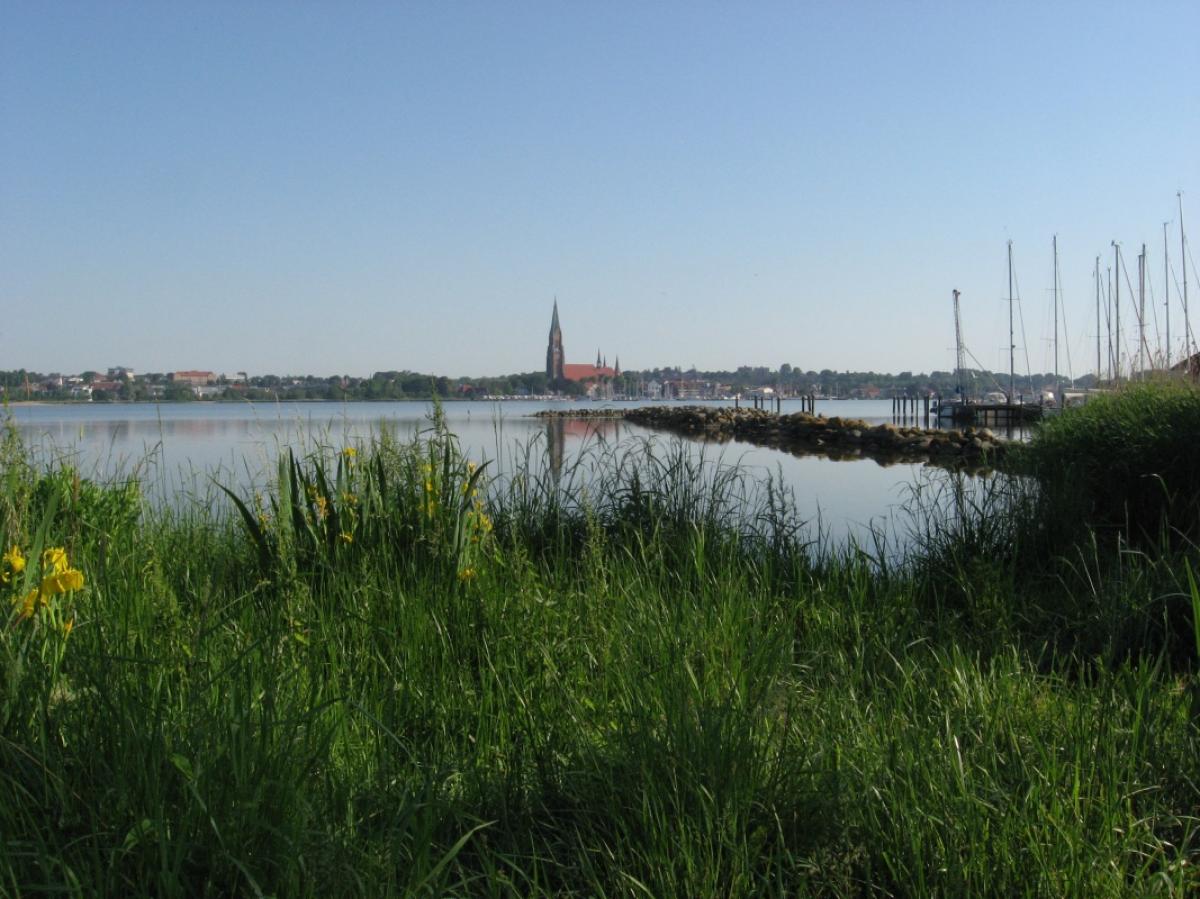
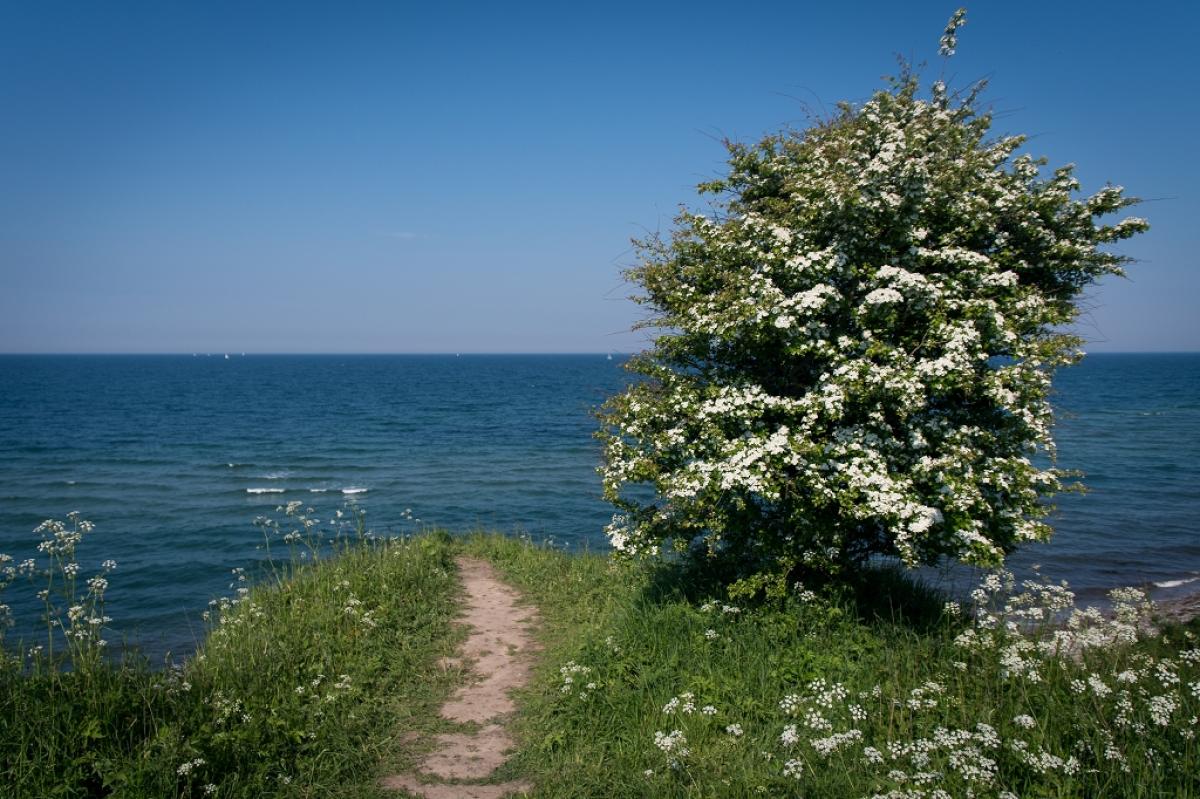
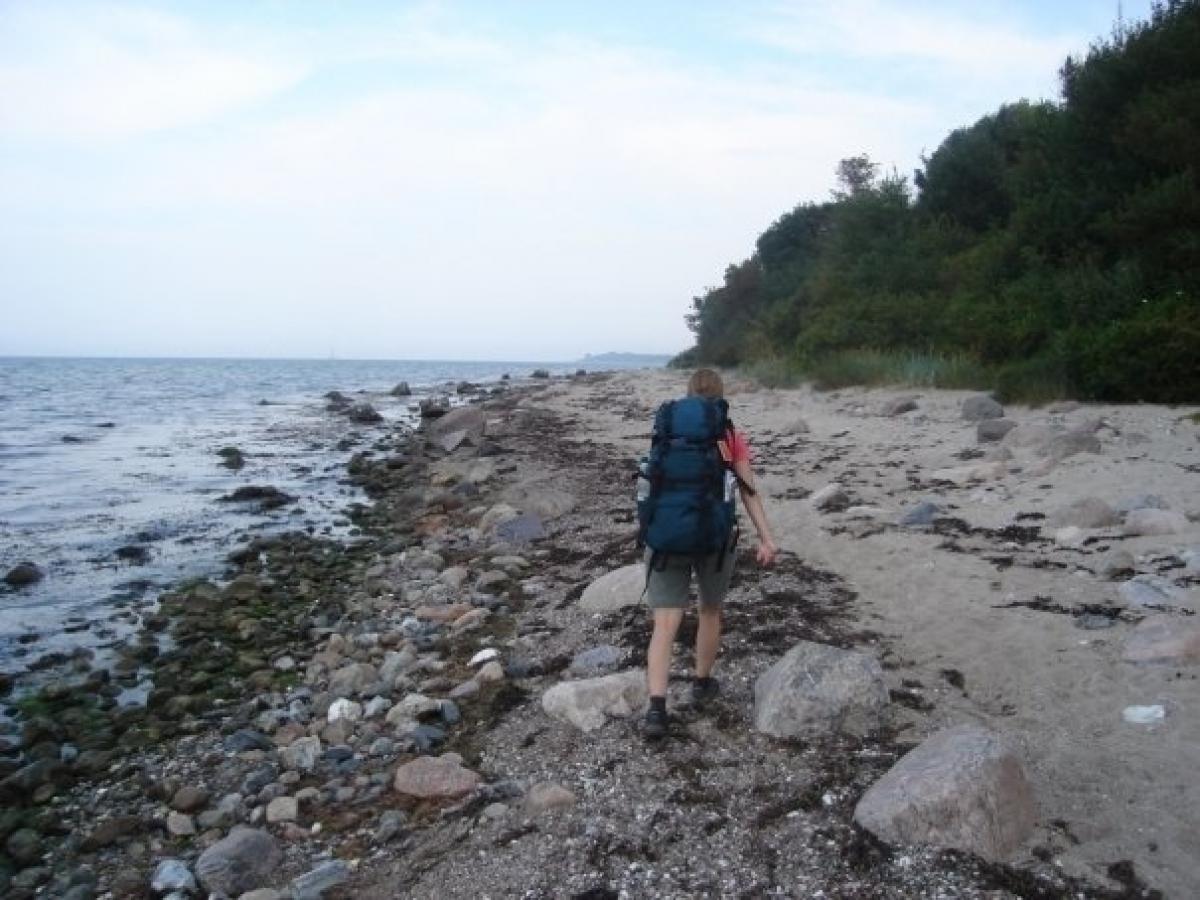
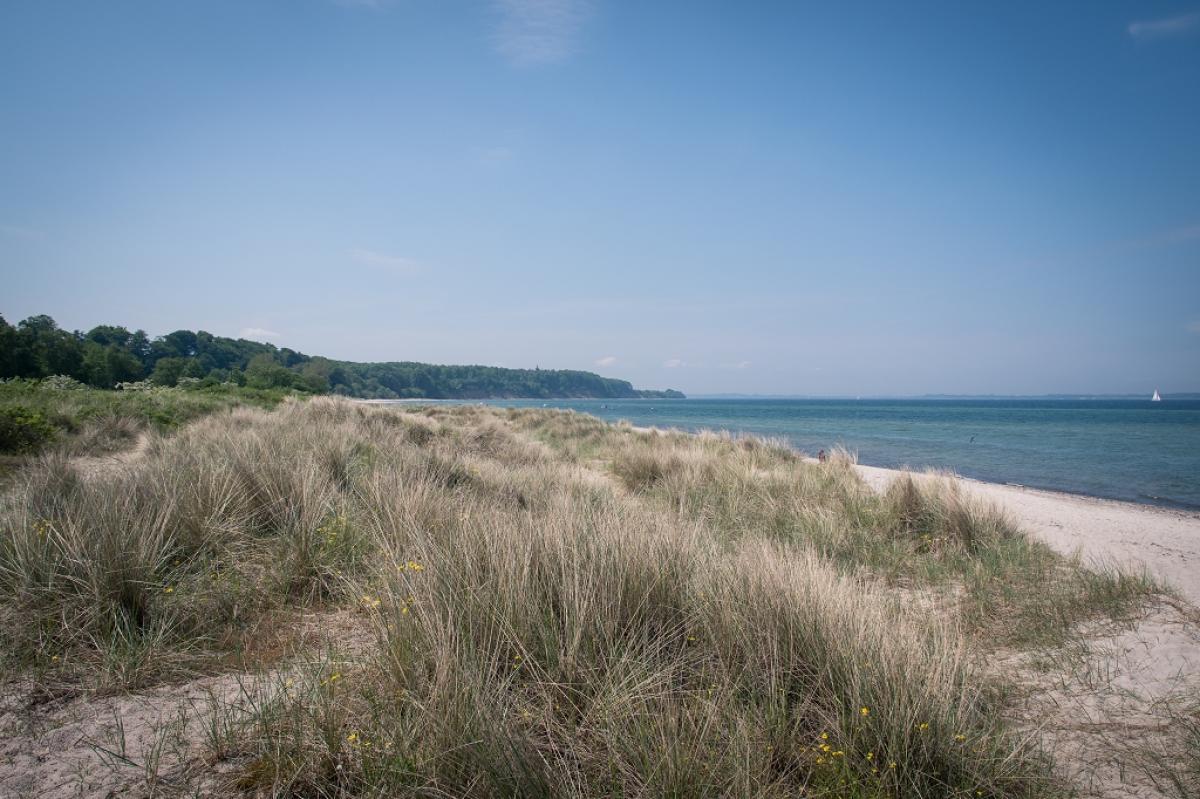
The E1 offers the opportunity to discover the far north of Germany on foot and surprises with a varied and attractive route. After the start at the copper mill (border to Denmark) it leads through Flensburg and Schleswig to the picturesque landscape at the Schlei. This is followed by sections along the Baltic Sea coast between Eckernförde and Kiel and the lake landscape around Plön.
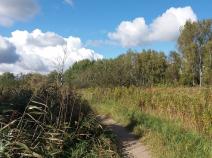
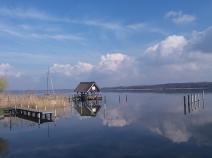
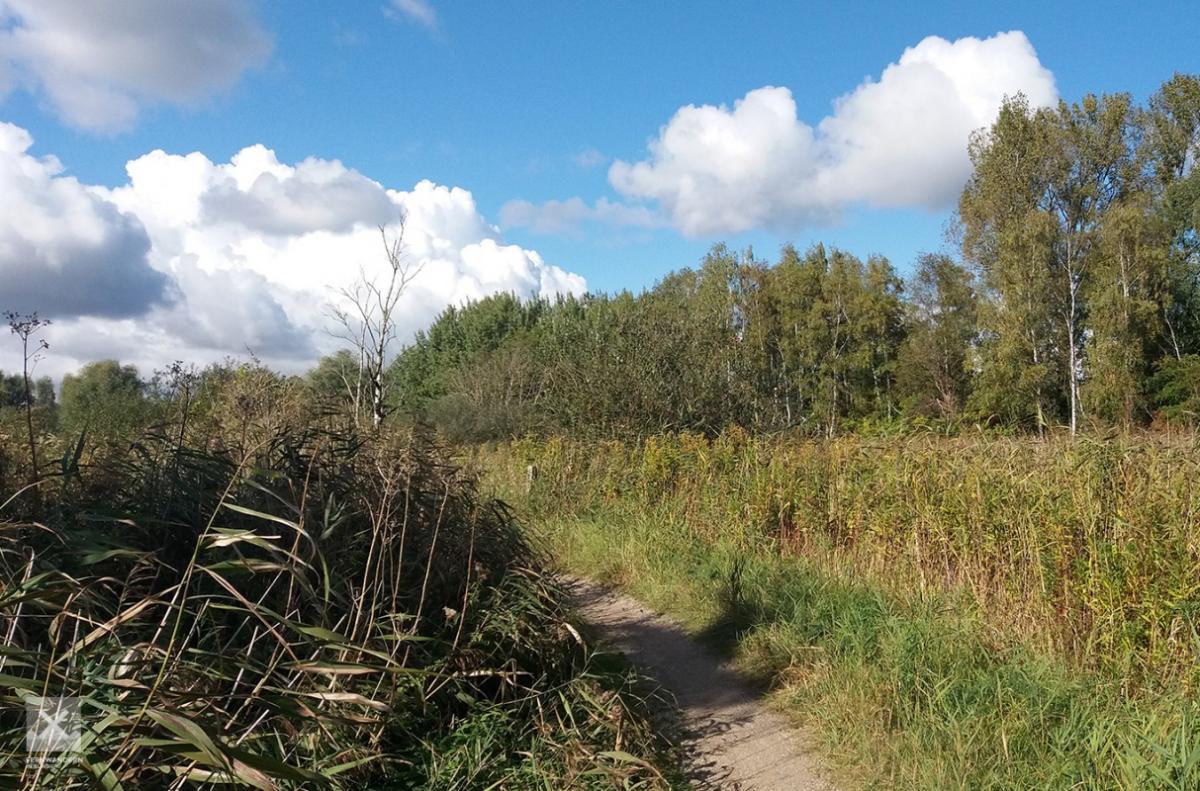
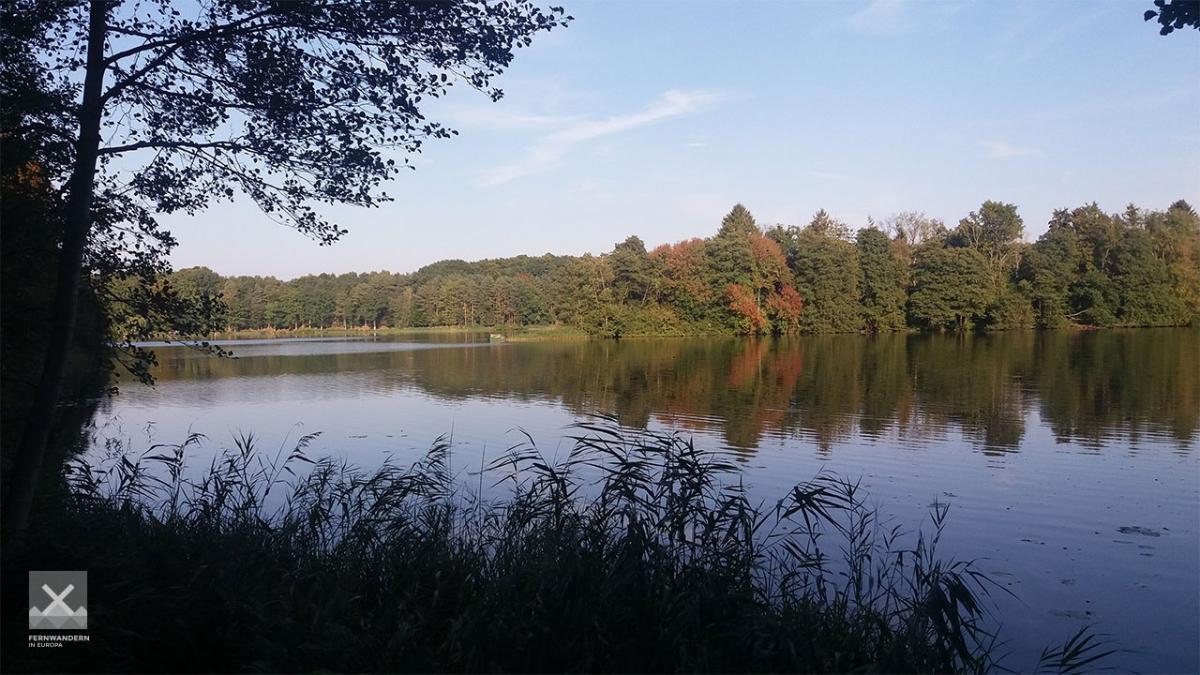
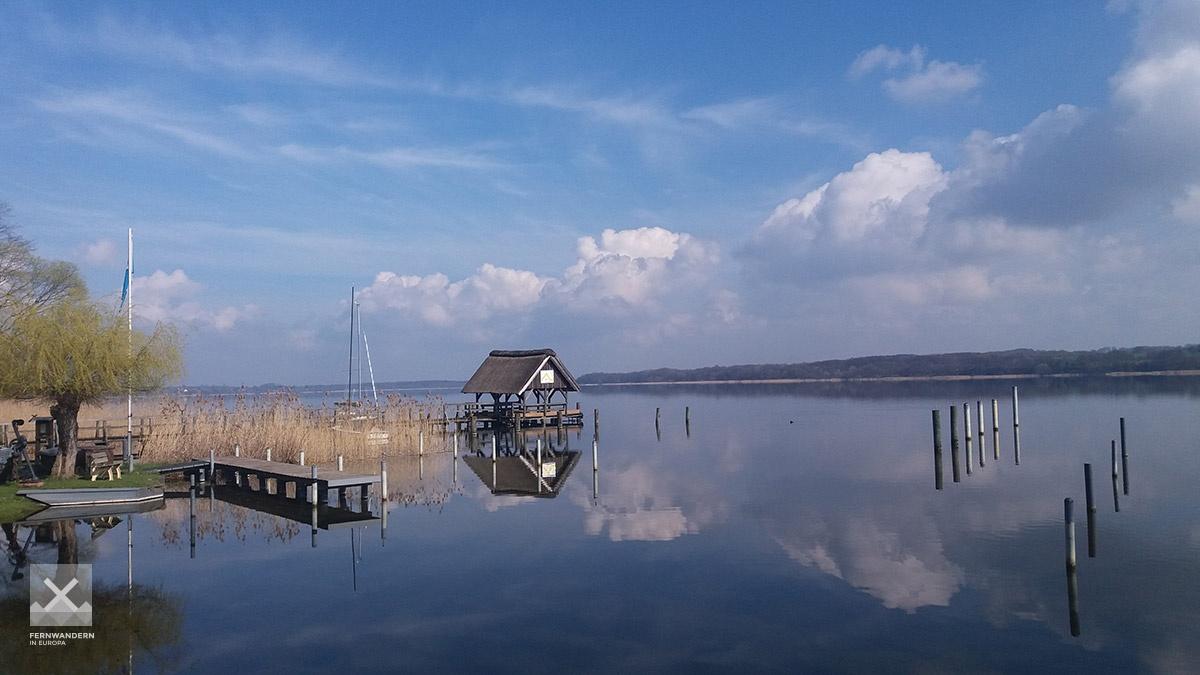
Further highlights are the stages along the Schwentine near Lübeck, the lakes near Ratzeburg and Mölln, the Hellbachtal nature reserve and the course along the Bille to Hamburg.
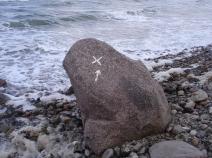
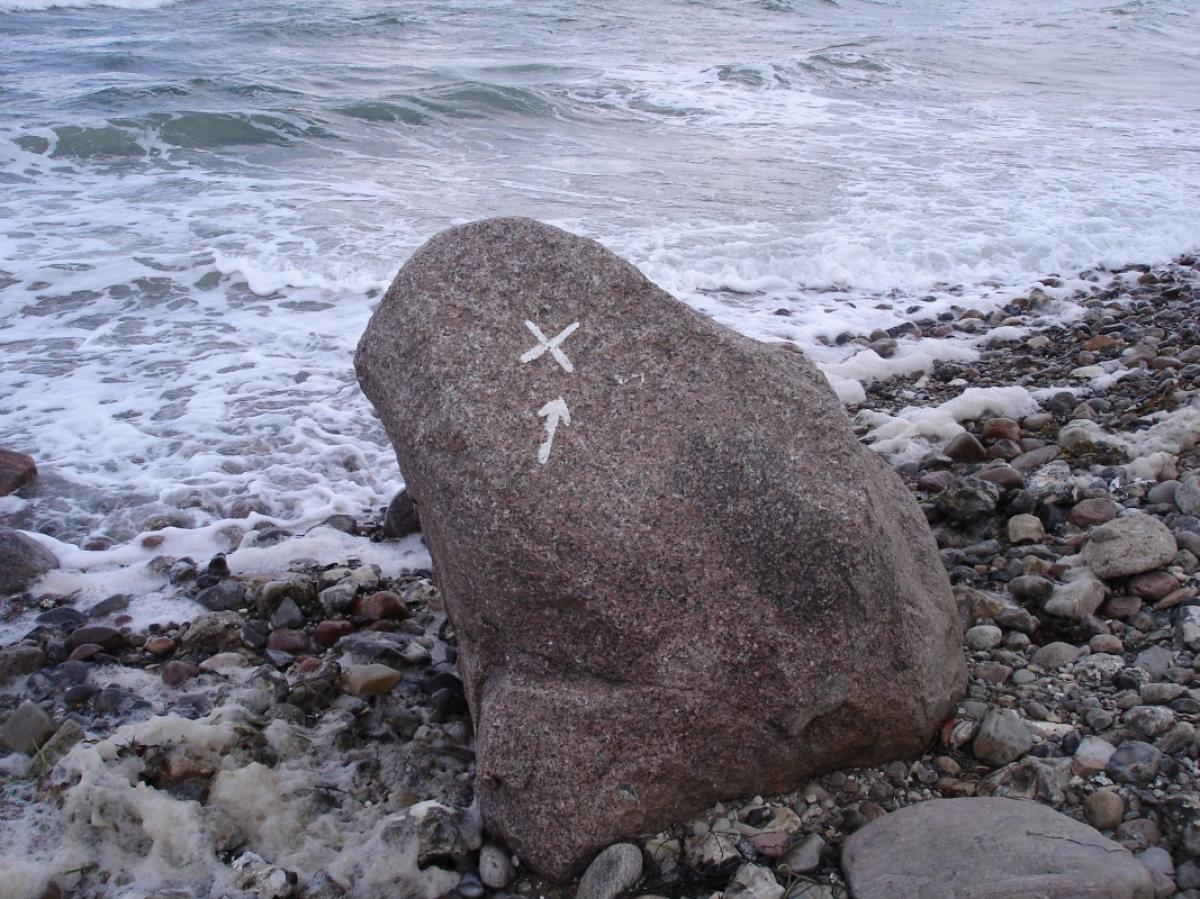
In addition to the "original" route through the eastern part of Schleswig-Holstein, there is a western variant between Schleswig and Hamburg, which is marked throughout with the St. Andrew's Cross. For this section we have not yet divided into stages.
The following users contributed to this text:
Translator(s) of this text:


Stage overview
| Stage | Distance | Walking time | Total climb | Total descent |
|---|---|---|---|---|
| 1.01 Danisch Border - Flensburg - Oeversee | 22.6km | - | 311m | 303m |
| 1.02 Oeversee - Schleswig | 30km | - | 340m | 366m |
| 1.03 Schleswig - Brekendorf | 20.8km | - | 294m | 275m |
| 1.04 Brekendorf - Eckernförde | 31.1km | - | 502m | 523m |
| 1.05 Eckernförde - Dänisch Nienhof | 23.3km | - | 498m | 474m |
| 1.06 Dänisch Nienhof - Kiel | 27.5km | - | 313m | 341m |
| 1.07 Kiel - Preetz | 17km | - | 293m | 270m |
| 1.08 Preetz - Plön | 24.8km | - | 383m | 379m |
| 1.09 Plön - Eutin | 24.9km | - | 319m | 322m |
| 1.10 Eutin - Schönwalde | 18.8km | - | 413m | 345m |
| 1.11 Schönwalde - Neustadt | 20.4km | - | 267m | 358m |
| 1.12 Neustadt - Bad Schwartau | 31.4km | - | 428m | 406m |
| 1.13 Bad Schwartau - Lübeck (Klein Grönau) | 31.4km | - | 339m | 353m |
| 1.14 Lübeck (Klein Grönau) - Ratzeburg | 29.2km | - | 331m | 339m |
| 1.15 Ratzeburg - Mölln | 13.9km | - | 200m | 182m |
| 1.16 Mölln - Güster | 18.9km | - | 233m | 233m |
| 1.17 Güster - Witzhave | 34.2km | - | 398m | 395m |
Climate
Meteorological station Schleswig, Germany (Altitude: 48m)
-
Monthly means of the daily highs and lows in degrees Celsius
Jan Feb Mar Apr May Jun Jul Aug Sep Oct Nov Dec ∅ Max. 2.2 2.9 5.8 10.4 15.5 19.0 20.1 20.4 17.0 12.6 7.2 3.6 ∅ Min. -2.0 -1.7 0.3 2.6 6.8 10.2 11.9 11.9 9.6 6.6 2.6 -0.6 -
Mean total precipitation in mm
Jan Feb Mar Apr May Jun Jul Aug Sep Oct Nov Dec ∅ mm 79.4 50.3 61.1 54.6 61.4 71.1 92.1 87.2 86.3 89.7 104.9 87.7
